Click on image for larger version
|
|
One Family's Growth |
|
|
Click on image for larger version
|
|
One Family's Growth |
|
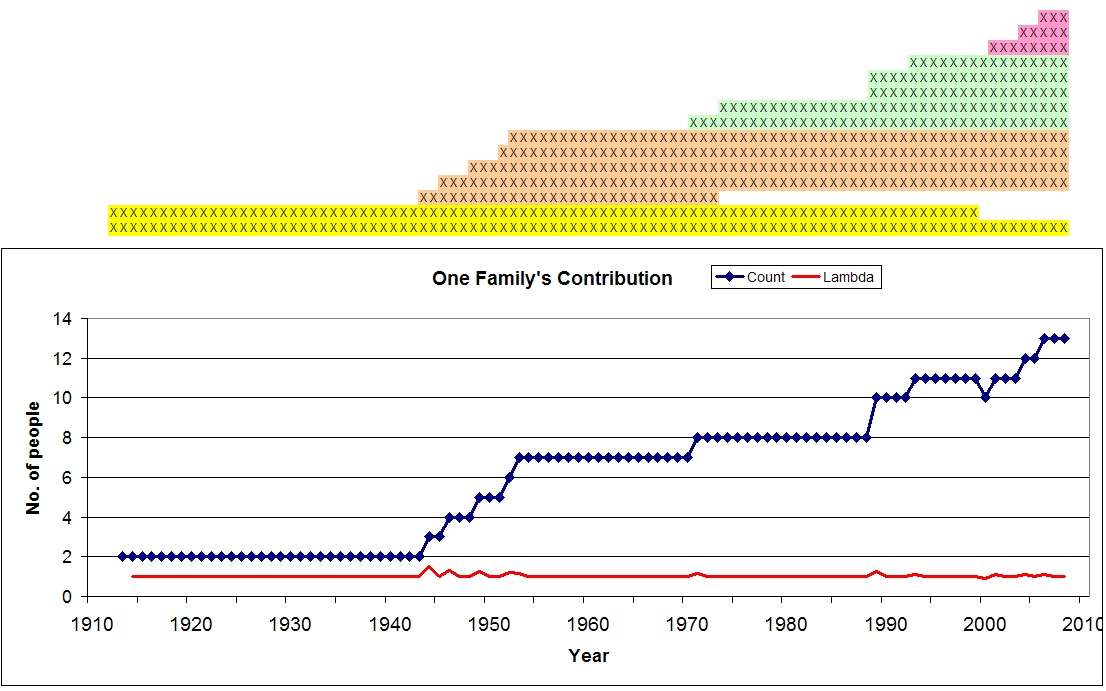
Growth Rate of One American Family, 1910-2010 |
Credit & Copyright: Dr. Bruce G.
Marcot
|
Explanation: This week -- April 22nd, in fact -- we get to wish you: In recognition of this (in?)auspicious occasion, I have charted a century of growth of my own family line. I have charted only my nuclear family starting with my parents. In the top part of the chart above, each row of X's represents an individual person. The different colors pertain to different generations: my parents are in yellow, my siblings and I are in orange, my siblings' children are in green, and my sibling's grandchildren are in pink. Below that is a graph that tallies the total number of people over time, shown in the blue line. The red line in that graph is "lambda," the annual finite rate of change of numbers of people. A lambda value greater than 1 means a growing population, 1 means a steady population, and less than 1 means a shrinking population; despite two deaths over this century's time, lambda dropped below 1 in only one year. What can we make of this? My parent's generation typically had larger families than do families today; I was the last of 5 children. But these 5 children have had only a total of 5 children of our own, or an average 1 child each; and then each of those children, so far anyhow, have had a total of 3 children, or an average of 0.6 children each. Thus, at least so far over this century's time, the mean number of offspring per capita (that is, per individual) in each generation has been shrinking (2.5, to 1, to 0.6) ... but the total number of individuals alive has been growing. How can this be? Herein lies this week's lesson. It is because generations overlap. Just because a couple has only two children or less does not mean that total population size suddenly stops growing. All those little bumps on the lambda line signify population growth spurts. Eventually, as deaths start to catch up to births, the total population size will level out, but it takes a few generations to do so. So if every couple on Earth decided to limit family size to 2 children, it would still take a few generations -- overlapping in time, as shown here -- for the world's total population to stop growing ... sort of like needing a mile of track to stop a heavily-laden train that continues to chug along. And as grows the population, so grows our collective carbon footprint, and so shrinks the average amount of resources available to each of us. More food for thought, on this Earth Day of 2008. Happy day .... !
|
Next week's picture: Sibling Rivalry Among Eagles
< Previous ... | Archive | Index | Location | Search | About EPOW | ... Next >
Google Earth locations
shows all EPOW locations;
must have Google Earth installed

Author & Webmaster: Dr.
Bruce G. Marcot, Tom Bruce
Disclaimers and Legal
Statements
Original material on Ecology Picture of the Week ©
Bruce G. Marcot
Member Theme of Taos-Telecommunity