In short, a Bayesian network (BN) is simply a way of showing how things interact and cause specific outcomes.
A Example of a BN Model
Instead of delving into theory and math, let's instead just work through a simple BN. This will show you how they are structured and how they work.
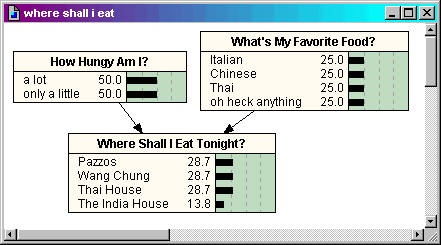
Here is a simple example of a BN:

Study this for a moment. It's about as silly and useless as it gets, but it works for an example here. If you specify how hungry you are, and what your favorite food is, the model would provide you with advice on where you might enjoy eating.
Each box is a node. The black bars and the numbers in the boxes depict probabilities for each state. So, before you tell it anything, the model doesn't know how hungry you are, so it sets the prior (default) probabilities for your state of hunger at 50-50. Ditto for your favorite food -- equal probabilities (25% each) spread across the 4 "states" of favorite food.
That bottom box, "Where Shall I Eat Tonight", is the output node. It will advise you on where you might want to eat. So this is a decision model. Or, more accurately, a decision-aiding model, since it's still up to YOU to decide what you want to do.
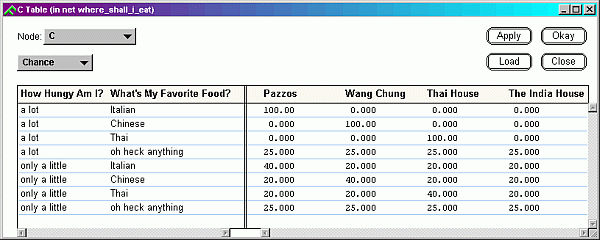
Yes, never let models dictate what you think! You can quote me on this: "Think of decision models like politicians ... use them, but never completely trust them. Always use your own best judgment."The bottom box in the above model is structured with what is called a "conditional probability table" or CPT. The CPT is a simple representation of how the input nodes combine to lead to the various output states ... in this case, how your hunger level and your favorite food might guide you to one restaurant or another. You can make CPTs very simple and deterministic (so that one set of inputs always leads to one result), or probabilistic (so that one set of inputs might suggest more than one result).
In this example, I set it up so the CPT is probabilistic. Let's take a look at it (click on the figure for a fuller size image, if needed):
Study this table for a moment. Look at the top row ... when you are "a lot" hungry, and your favorite food is "Italian," then this pushes you to consider the restaurant "Pazzos" (an Italian favorite in Portland, Oregon, trust me) 100% of the time, and all other restaurants get 0% consideration. But look at the bottom row ... when you're "only a little" hungry, and have no real favorite food, then anything goes, and all 4 restaurants are equally considered OK (at 25% probability each). See?
The probabilities in CPT tables come from your best guess when you build the models ... they can also come from real field data and observations. Or a combination of best judgment and real data. That's cool.
OK, so what? Well, this means that as you choose different combinations of the input variables (here, hunger level and favorite food), the results will follow according to how the probabilities were set up in the CPT table. In this very simple 3-node example model, it's pretty obvious what the results will be, simply by inspecting the above CPT table. But in real-world decision models, they can be far more complex and not so obvious.
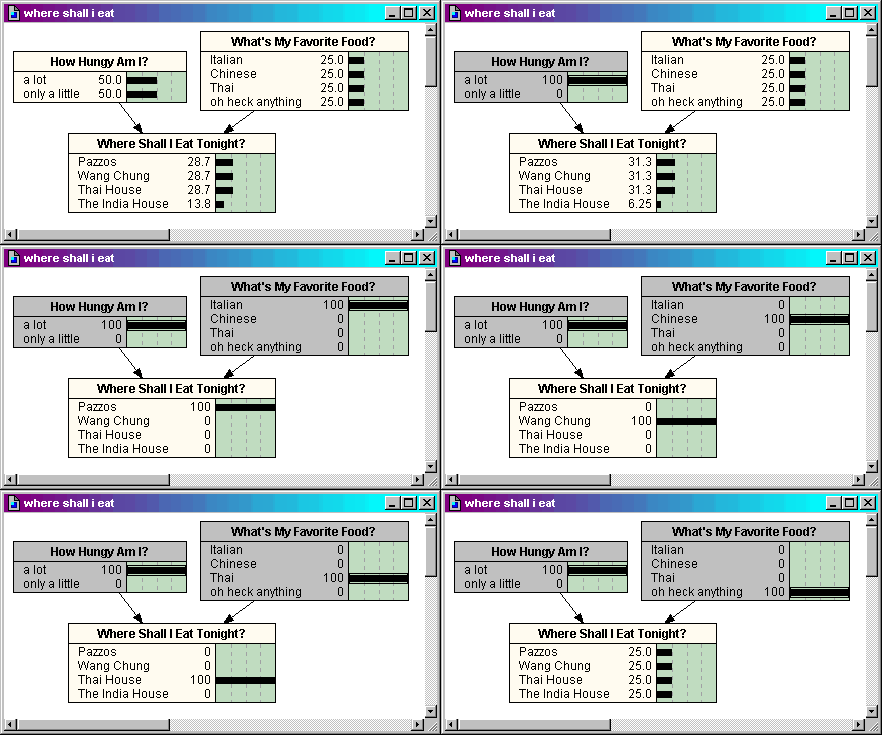
So, let's take this silly little BN model for a spin. The following two figures should be animated, with dancing probability bars (if not, then hit try hitting the "refresh" button on your browser and wait for it to reload).
First, let's lock in the hunger node to the state "a lot," and then try out the various favorite foods. The way I set up the CPT probabilities above, when you're really hungry it drives you fully to your favorite food, unless you don't have a favorite. Check it out:

(No, there's nothing for you to click on here .... just view the animation.)
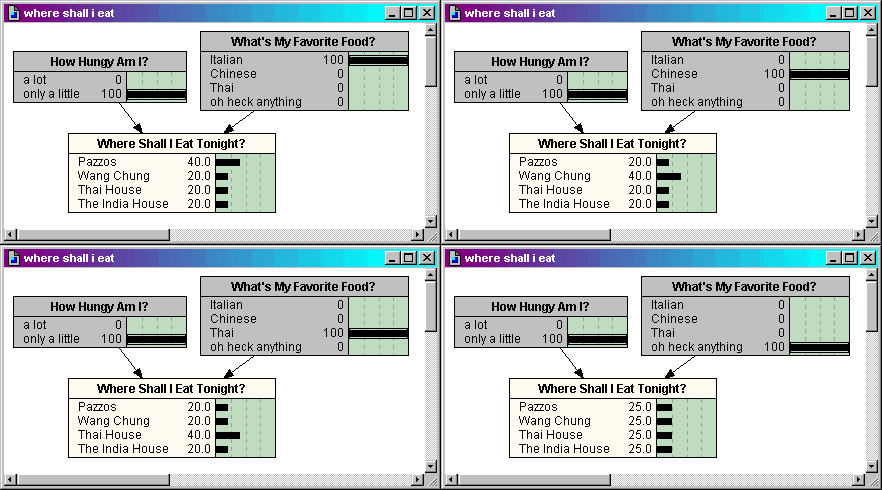
Next, let's lock in the "only a little" hungry level, and see how the various favorite foods affect the model's recommendations for restaurant selection:

Aha, when you're only a little hungry, you have some tolerance for other foods. (OK, maybe I got that backwards, but you get the idea.)
BNs can be this simple ...
or very complex.
Why Use BNs?
Decision criteria can be represented in a variety of ways ... plain text guidelines, or with "decision trees," fuzzy logic models, or other means. BNs have several key advantages over other tools:
- BNs can explicitly lay out parameters in a decision process.
- BNs explicitly depict uncertainty as probabilities, which can fit well in a risk analysis and risk management framework.
- BNs can be used to help identify key factors that most influence some outcome of interest, to help prioritize monitoring or research.
For Further Exploration
Where can you learn more about BN structures and such? Here are a few links for the ambitious learner:
- Introduction to Bayes Nets by Norsys Inc. (maker of the model Netica, which is used in the examples shown above)
- Tutorial Introduction to Belief Networks by Amos Storkey
- One other source is my own little corner of the web ... a page on creating BN models in ecology.
![]()
NOTE: Some of the literature -- including earlier items of my own -- use the term "Bayesian belief network" (BBN).
I have come to shorten this to just "Bayesian network" (BN) and to drop "belief" ... because BN models can be constructed partly or entirely from empirical data, so that they are far more rigorous than just being a representation of one's "belief" ... and also because, for some users, "belief" may suggest less than rigorously vetted knowledge and something more arbitrary, which is not what we want our scientific models to be.
