|
Explanation: NASA's Vital
Signs program has recenty reported the following:
-
The ice sheets of Greenland are declining
some 273.0 billion metric tons per year since 2002.
-
The ice sheets of Greenland and Antarctica
compose some two-thirds of all the fresh water on the planet.
-
And melting of these sheets contributes
about one-third of global sea-level rise since 1993.
Other studies (Box et al. 2022) project that,
if the melting of Greenland's ice sheets continue from its high-melt year of
2012, sea levels will rise some 2.6 feet (782 mm), a significant enough rise
to inundate
many coastal
cities, farmlands,
and inhabited
areas on a global scale.
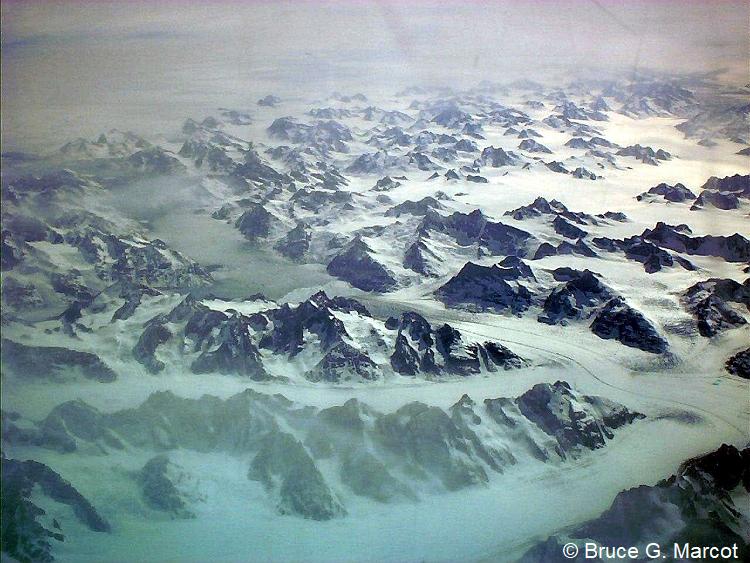
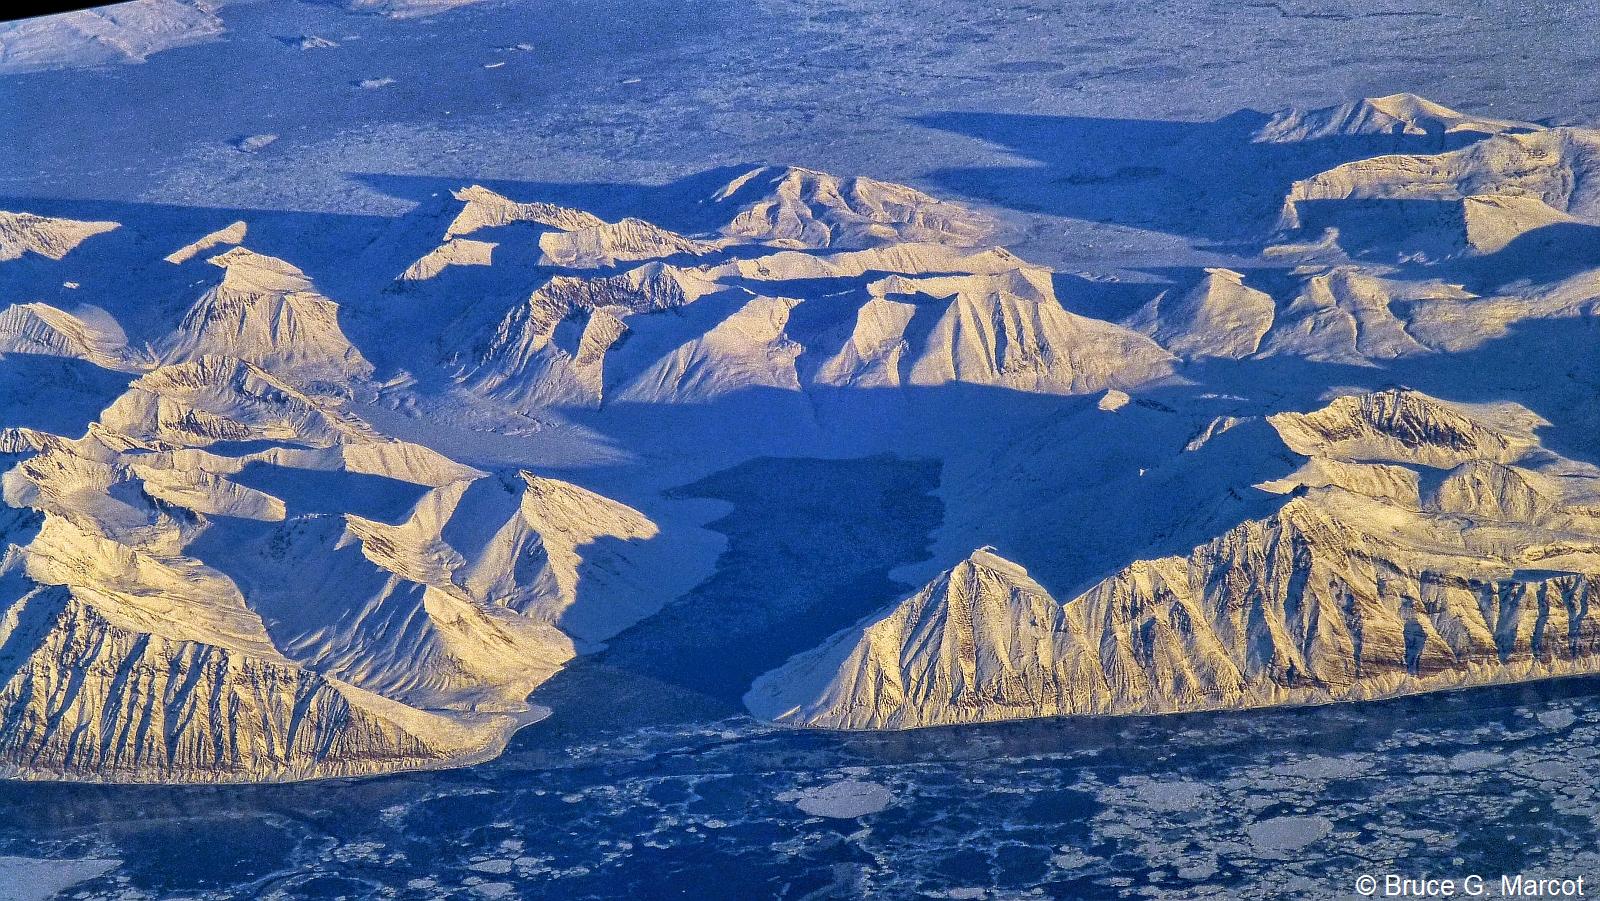
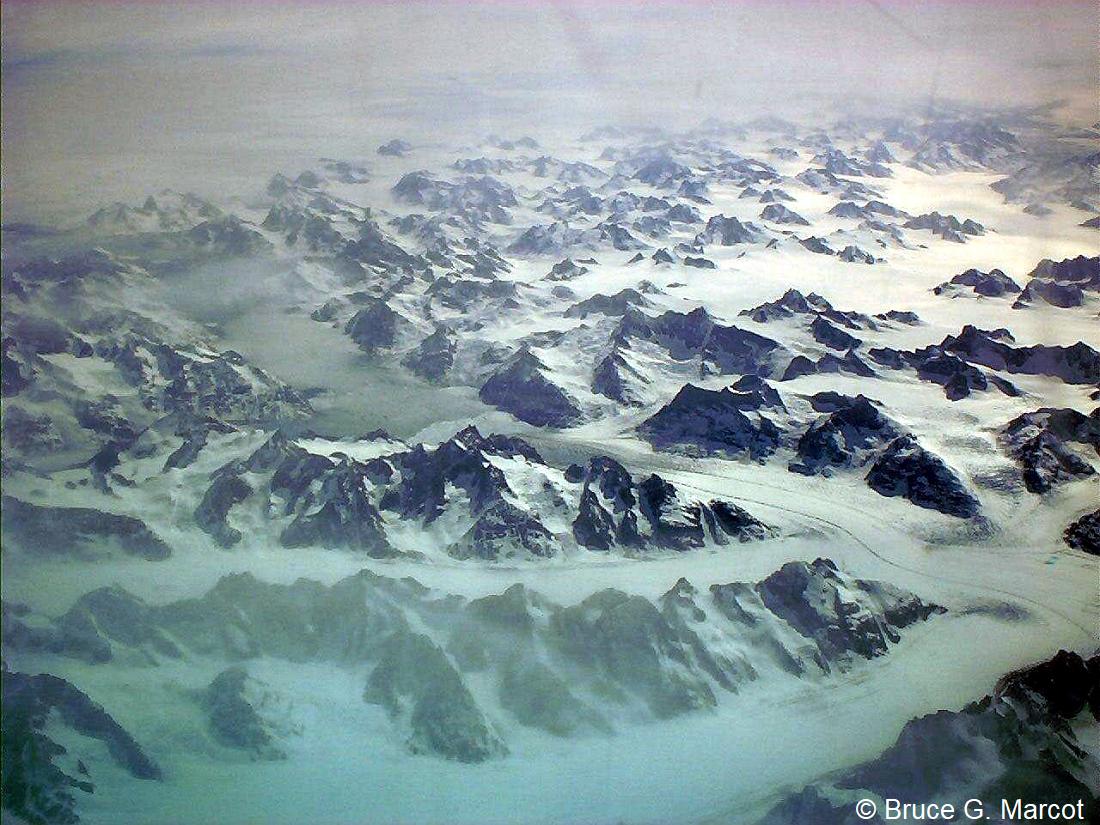
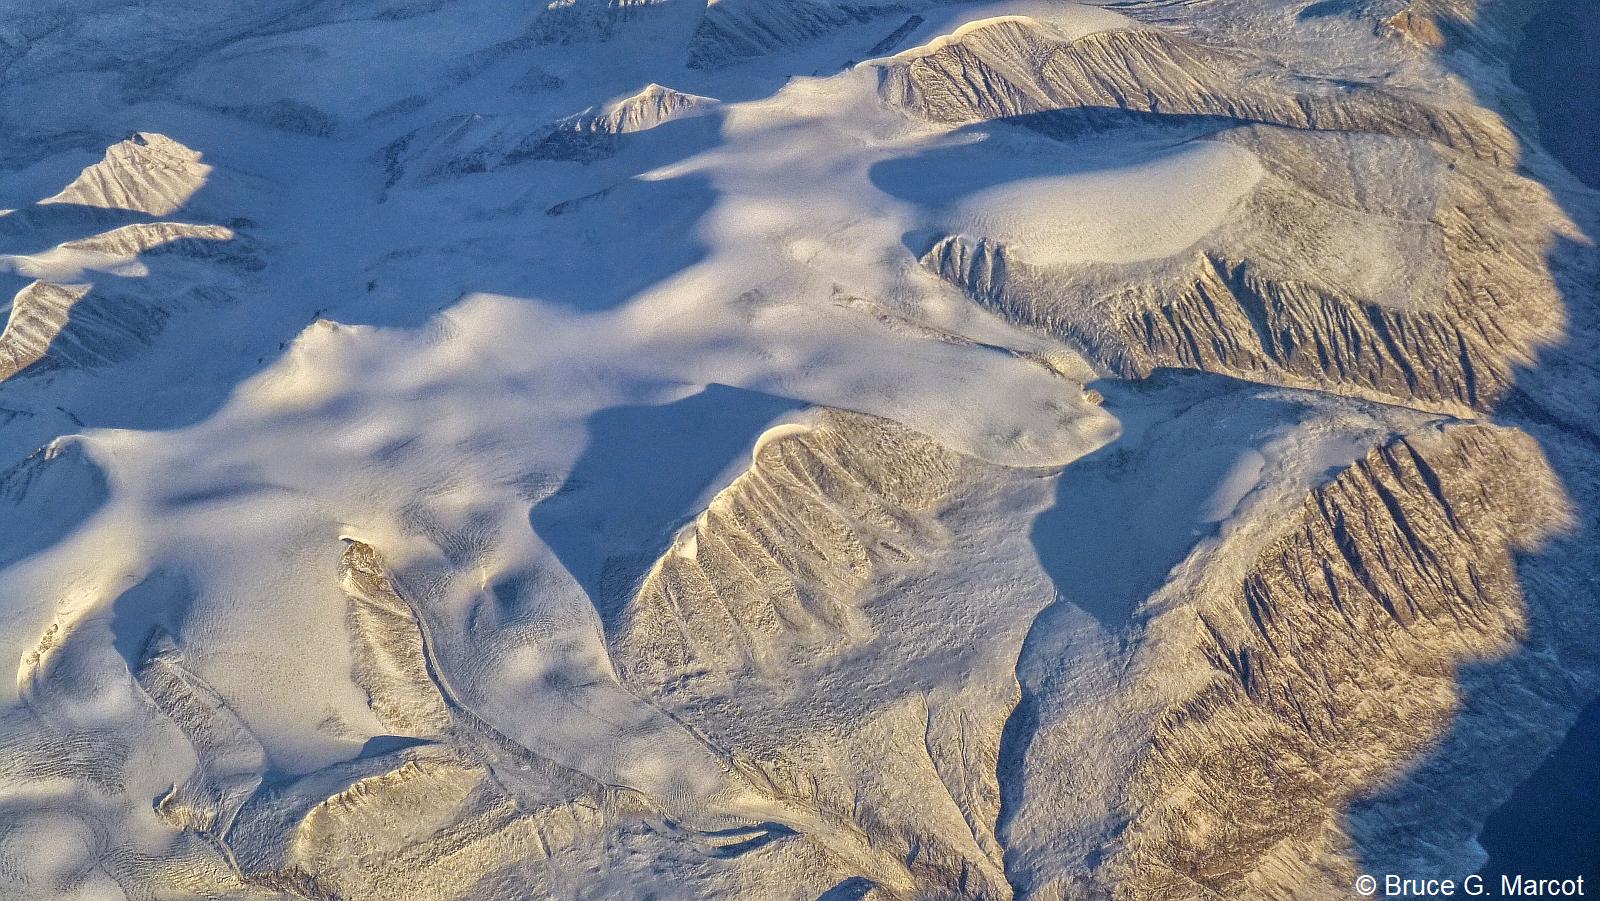
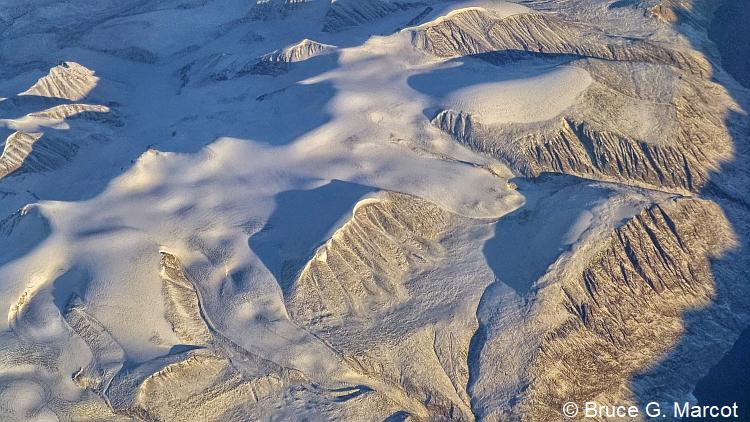
A flight over eastern Greenland shows glacial rivers of ice,
but if you look carefully at the left center of this photo
you will see a large inland lake has formed from the meltwater.
Here, the tongues extending from the ice sheet appear intact
but studies have shown how meltwater penetrates
to lubricate where the ice meets the rock,
speeding up the glacial flows into the sea interface.
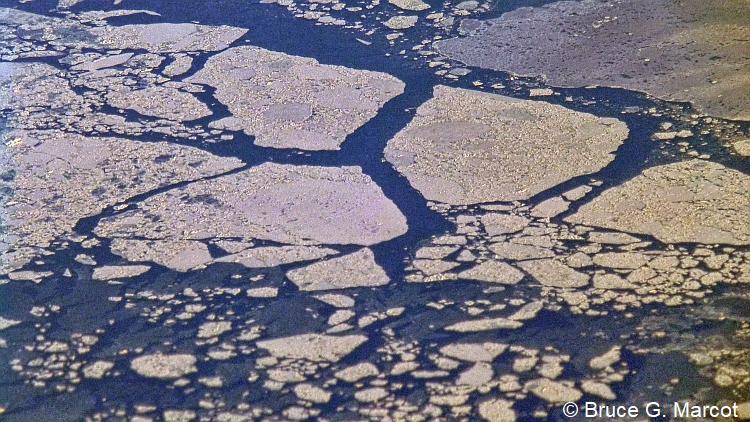
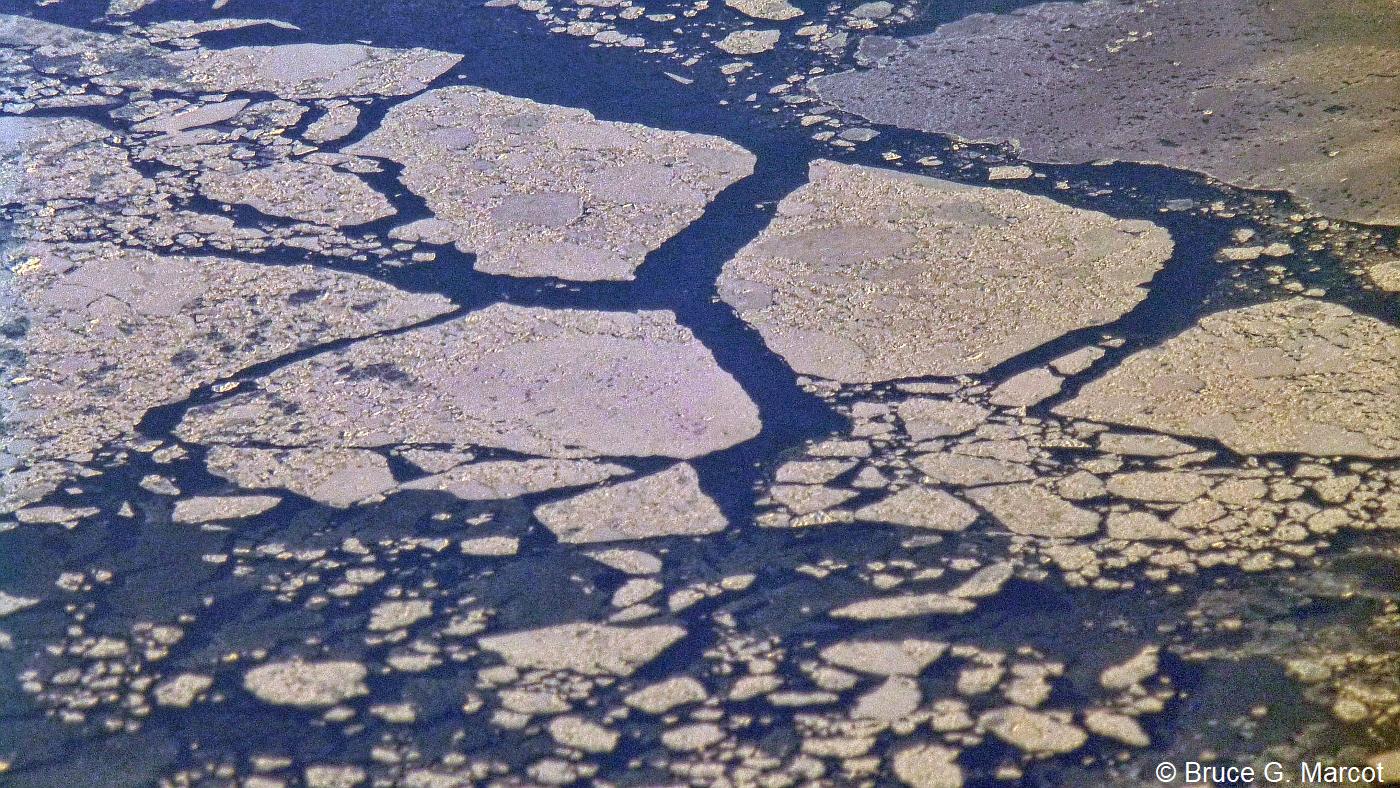
And here is where the problem, and the sea level, arise,
where the ice toes (upper right) fracture into icebergs that
then melt.
And yes, it is the melting ice coming from the
glaciers that
cause
sea-level to rise.
You can test this yourself with a glass of ice water.
The ice cubes in the glass are already floating in the water,
much like the ice that formed on the sea surface.
Now let the ice melt in the glass;
does the water level overflow the glass?
No.
But now add more ice to the glass, and watch
how the water level does increase. Your glass is the
ocean basin.
And the ice you add is the meltwater from the glaciers.
BUT ... also try this:
Fill your glass half-full with ice. Then add some water.
Mark with tape on the side of the glass where the water level is, amongst the
ice.
Now let the ice melt, and re-measure where the water level is now.
You'll see that the water level has risen, although, as above,
it won't flow over the top of the glass.
This says that
although the total amount of water,
in both its liquid and solid ice forms,
hasn't changed, the liquid form does rise within the glass. If
the world's ocean basins are the glass,
and the floating sea ice, icebergs, and other ice masses
are the ice cubes in the glass,
if that ice melts then the water level does rise.
Information:
Box, J.E., and 11 others. 2022. Greenland
ice sheet climate disequilibrium and committed sea-level rise.
Nature Climate Change https://doi.org/10.1038/s41558-022-01441-2
|
Index |
Location | Search | About EPOW | ... Next >
Google Earth locations