|
|
|
Cascadia Quakes |
|
|
|
|
|
Cascadia Quakes |
|
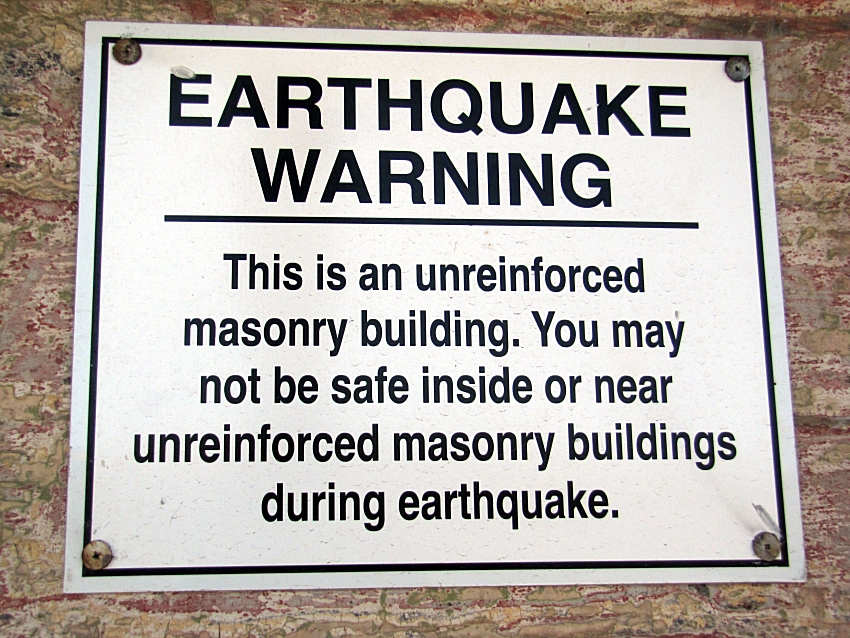
Earthquake Warning Sign |
Credit & Copyright: Dr. Bruce G.
Marcot
|
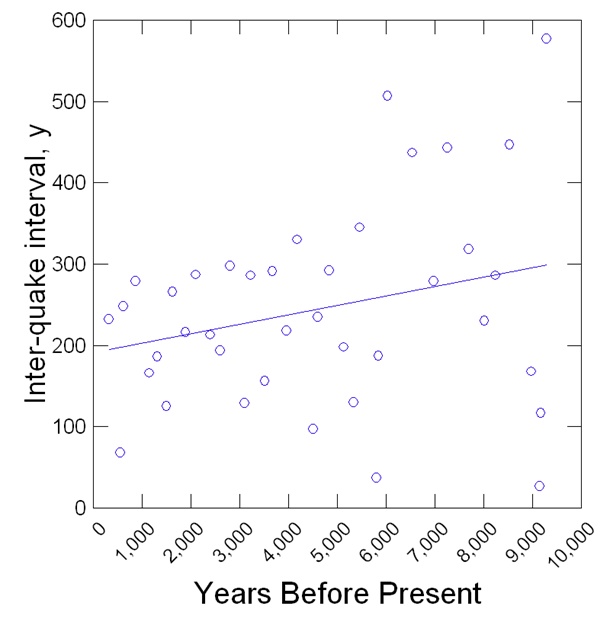
Explanation: This week, as we look ahead to the New Year, with hope that the continuing COVID-19 pandemic will at last subside, we also look back to the deep history of another set of catastrophic events: the so-called major Cascadia Fault Earthquakes that have occurred off the Pacific Coast of North America. These quakes have exceeded a massive magnitude 9. In the main image, above, is a cautionary sign that I encountered in Geyserville, California during a wine-tasting tour. We are reminded that sudden jolts can be without warning and can carry dire results. (I'll not drink to that!) So, for this week, I have further analyzed a database of "10,000 years of Cascadia earthquakes" with some new insights into their patterns ... or lack of patterns, bolstering the warning about unexpected events. The above-linked page notes that, in their database, the average Cascadia quake recurs every 246 years. So we're safe, right? Well ... ... the intervals between the quakes might average that time frame, but they vary a lot, and there's no real pattern. Here's my plot of the inter-quake interval in years, plotted for all quakes over time. NOTICE here that the more recent quakes (toward the left of this plot) are slightly more grouped and also are occurring perhaps in shorter intervals, although those intervals still span quite a wide timeline of about 80 years to about 300 years between the major quakes:
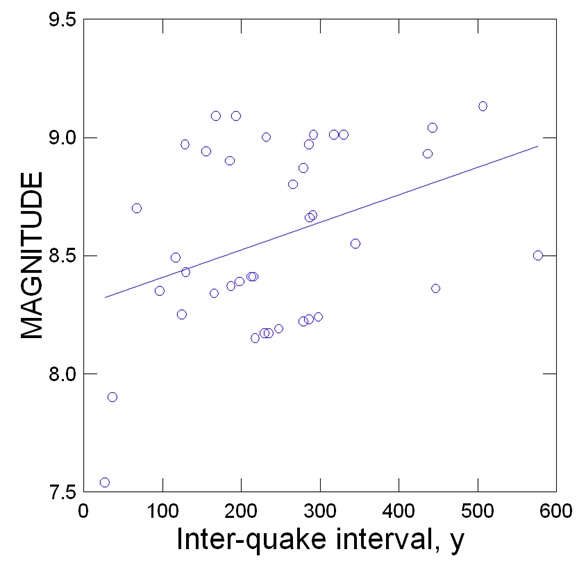
It has been about 320 years since
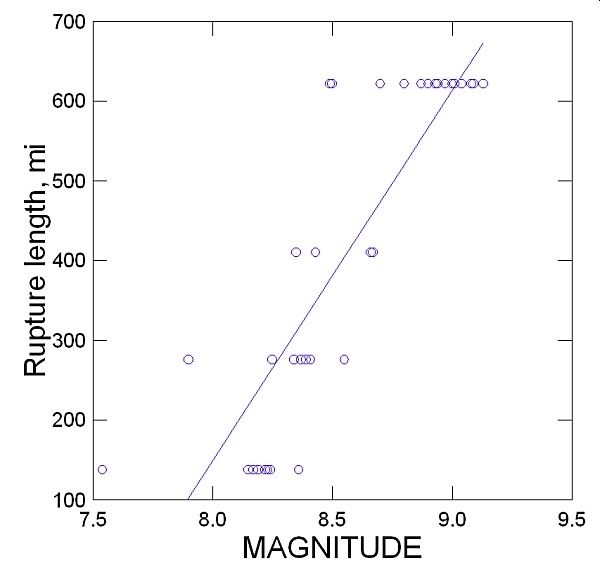
the last major Cascadia quake event. Does that make us safer? Well ... no. This next plot shows that the longer it is between these quakes, the stronger the quakes are. This makes sense, as seismic stress along major fault lines builds up to the eventual point of rupture. So an interval of 320 years means, on average (with lots of variation, though), the quake would be about magnitude 8.6. Yikes.
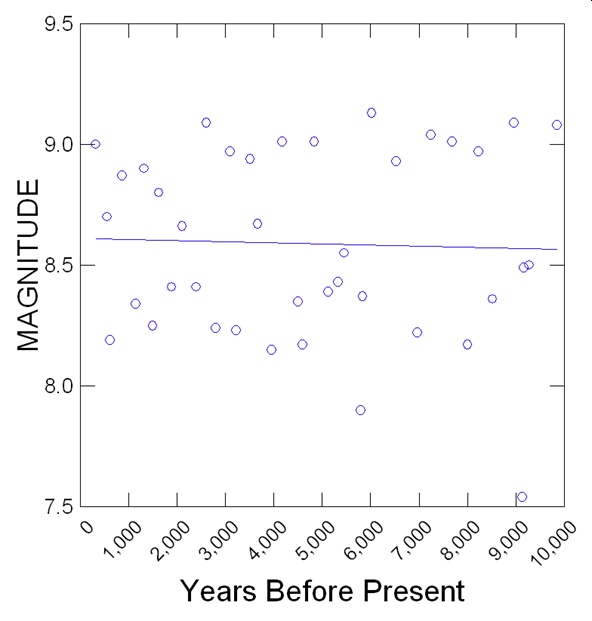
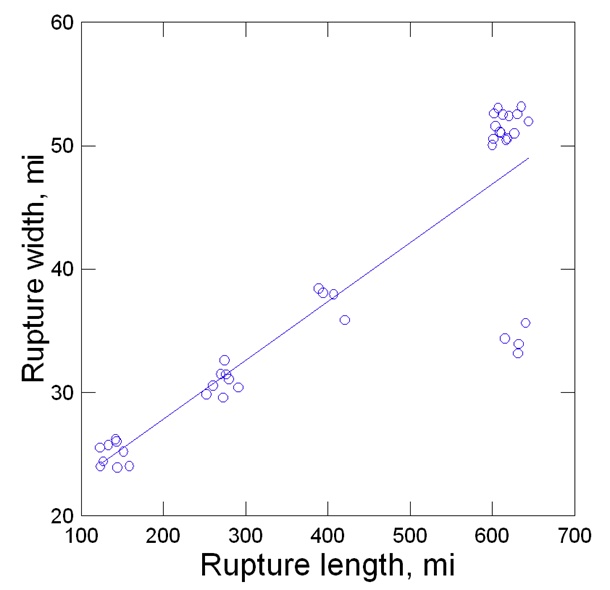
But are the magnitudes of the quakes getting smaller, or bigger, over time? This next plot, below, says ... neither small nor bigger, just very variable:
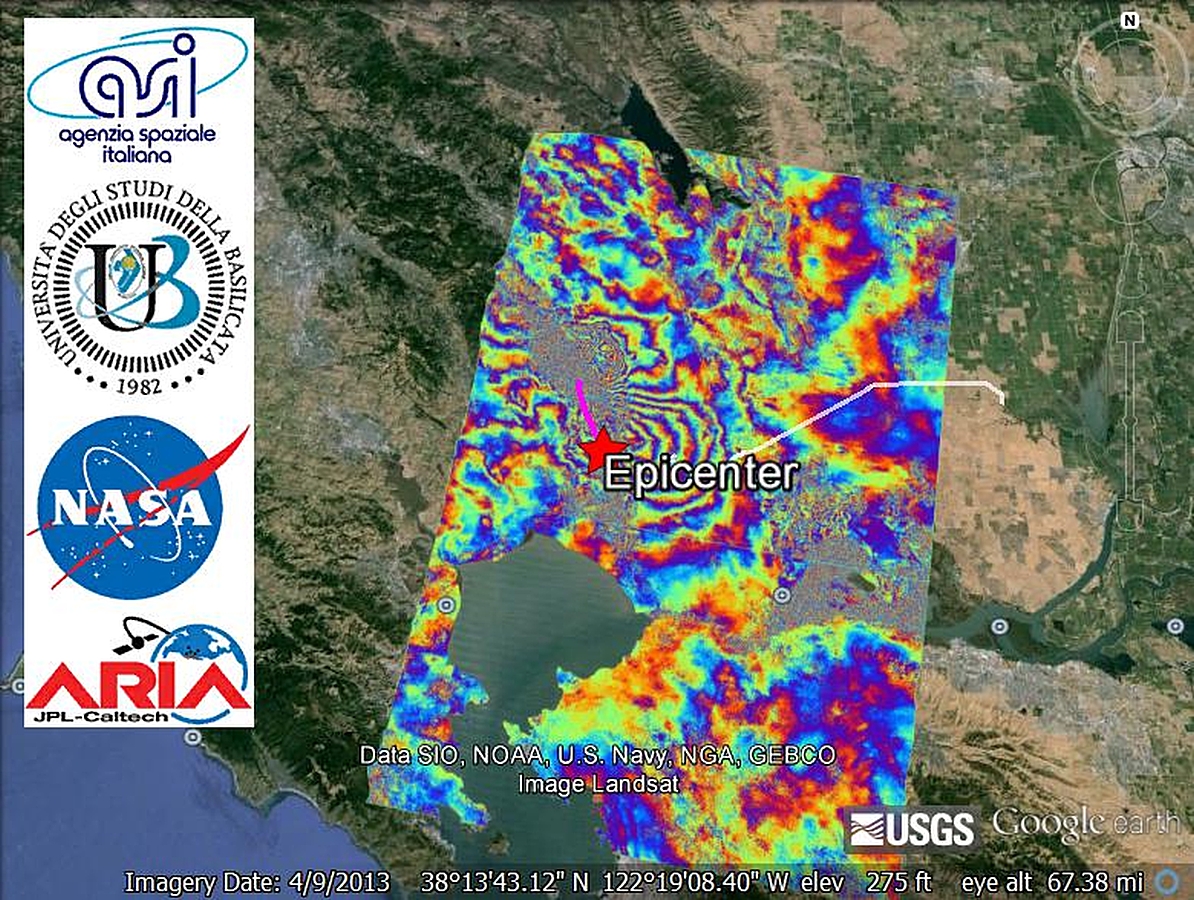
Finally, here is an example of a big quake in recent history that occurred on August 24, 2014. It is not a Cascadia-scale event, but was a major shake of magnitude 6.0 that created much damage in the city of Napa, California and nearby.
|
Next week's picture: Boar in the Meadow
< Previous ... | Archive |
Index |
Location | Search | About EPOW | ... Next >
Google Earth locations
shows all EPOW locations;
must have Google Earth installed
Author & Webmaster: Dr. Bruce G. Marcot, Tom Bruce
Disclaimers and Legal Statements
Original material on Ecology Picture of the Week © Bruce G. Marcot