|
|
Brown Noise in Flight |
|
|
Click on images for larger versions
|
|
|
Brown Noise in Flight |
|
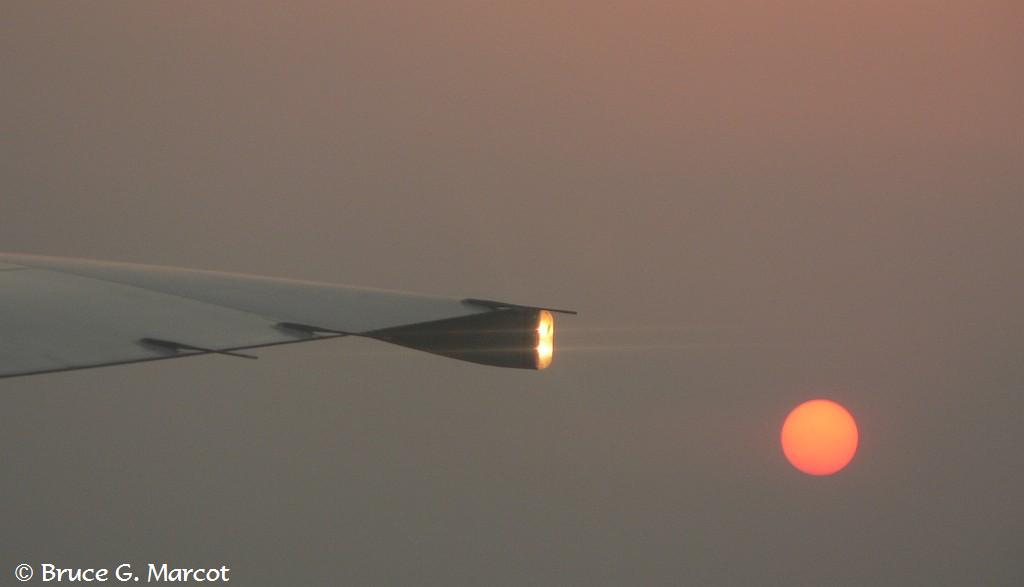
Setting sun, Assam, Northeast India |
Credit & Copyright: Dr. Bruce G. Marcot
Explanation: Have you ever fallen asleep on a flight? But have you also been aware of how loud the noise is onboard a commercial jet airplane? How you can sleep in all that din?
On a recent flight I got the idea to explore this, using my tablet and my digital audio recorder. Call this EPOW episode an investigation into the human environment of an airplane.
First of all, listen here to the (probably familiar) sound of the airplane cabin. To clarify, I was on an Alaska Airlines flight run by Skywest Airlines, and the plane was a Canadair (Bombardier) Regional Jet 700 running two GE CF34-8C5B1 turbofan engines ... a typical transport along the west coast of the U.S. I was in window seat 1A, up front.
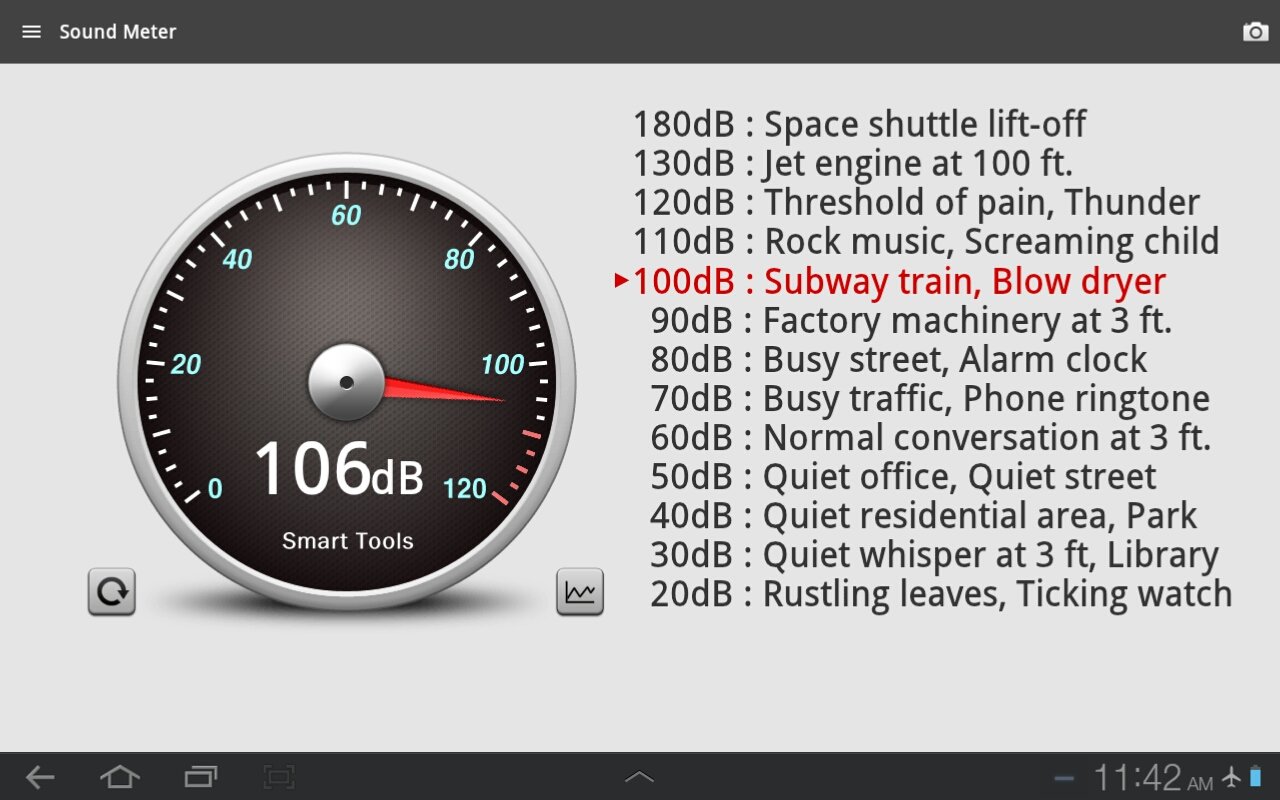
Guess how loud it is on such a typical airplane as this.
OK, here's what I found:
Once we leveled off, the noise at my seat was a very consistent 105-106 dB (decibels) ... as loud as a subway train or blow dryer, and louder than a busy street, factory machinery and even an alarm clock!
So how in the world can you nod off in all that din?
Here's the answer I discovered: it depends on the frequency distribution of the sound.
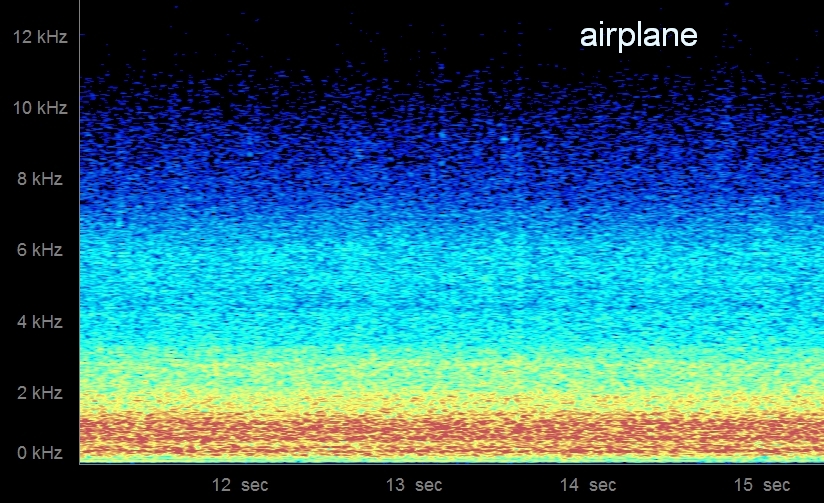
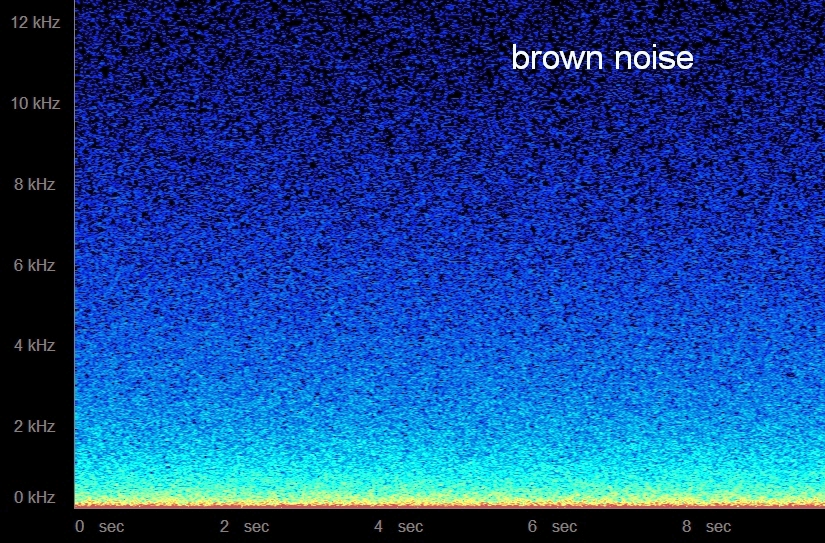
Let's take a look at a sound spectrogram plot of my audio recording:
Sound spectrogram plots display sound frequency ("pitch") on the vertical axis, shown above in kHz (kilohertz, or thousand cycles per second), and time along the horizontal axis. Note that here is not much change in the distribution of frequencies over the duration of this short recording; the noise in the plane was pretty constant, like a continuous "whoosh" sound. You've heard it.The colors in the above plot say something about the amplitude ("loudness"). Reds are loudest, blues softest.
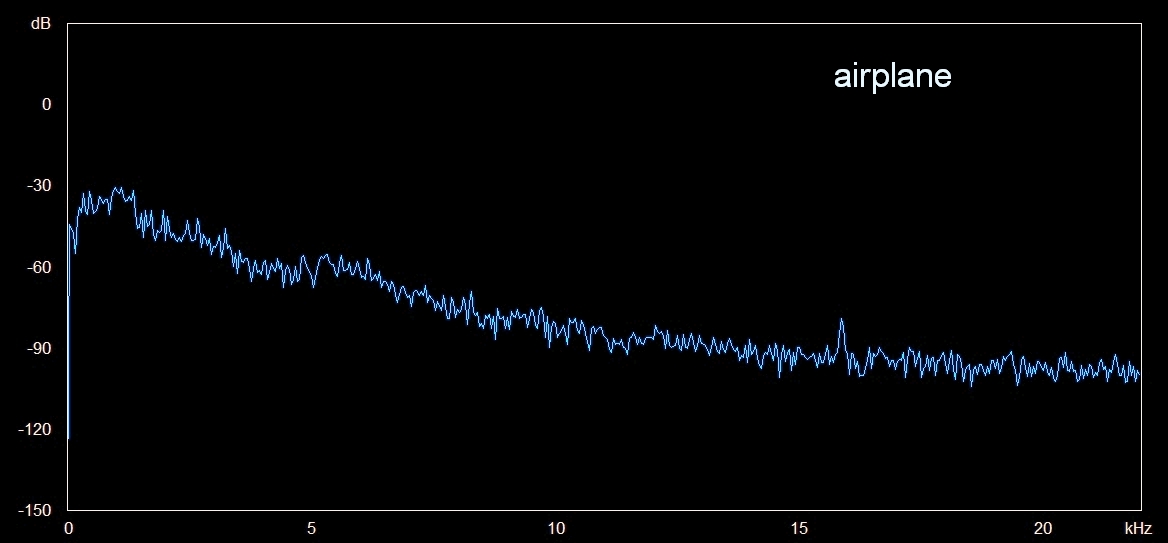
So now picking any (random) point along the time axis, you can produce a frequency profile plot:
Now, this plot shows amplitude ("loudness") on the vertical axis, and frequency (kHz) along the horizontal axis ... for the specific point in time you picked on the first plot above. The vertical axis is (typically) scaled with zero at the top representing the loudest possible sound in the overall file, diminishing in volume as you go down the vertical axis to more negative values.
This particular "frequency profile" plot -- which we'll use more of here -- says that the loudest frequencies are the lower frequencies, such as below 10 kHz (just as you saw in the red-to-blue spectrogram figure further above), and the loudness (amplitude) distribution along the frequencies is smooth and continuous with no big leaps.
So what?
Well, compare the above sound frequency pattern to other, known patterns.
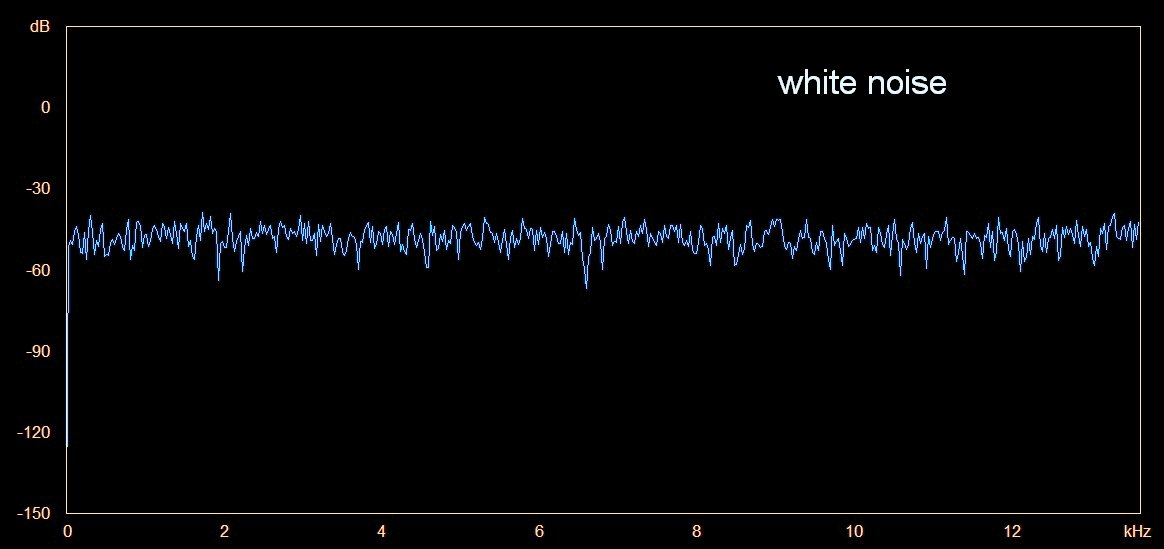
One you might already be thinking of is white noise, which some people use to help them fall asleep. But ... white noise is different. White noise has equal amplitudes across the frequency spectrum.
For this and subsequent comparisons here, I turned to the web site AudioCheck, that has a fine array of various types of sound files and descriptions. I'll include specific links to each, below.
The frequency profile plot for white noise looks like this, which is different than my airplane sample:
White noise has also been used to describe the sound of rushing streams, wind in the trees, static on the radio, and other sources.
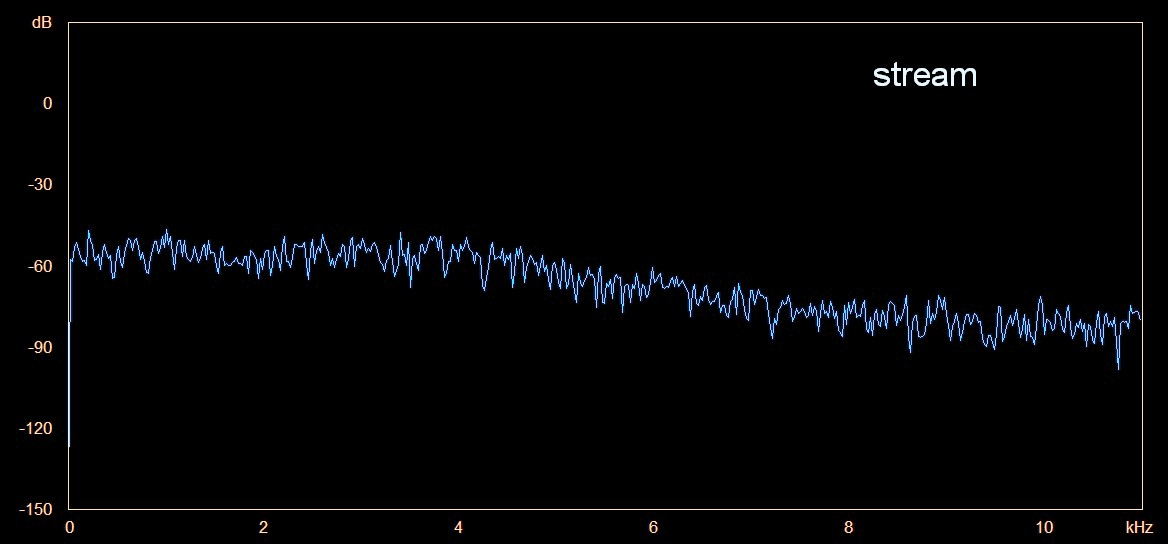
For instance, here is a frequency profile plot of a recording I had made of a stream in a myrtle beech forest (Nothofagus cumminghamii) in South Victoria, Australia -- and it looks pretty much like the white noise plot, above, although it drops a little bit in power at the higher frequencies:
So what about other noise types? Maybe you didn't know about these.
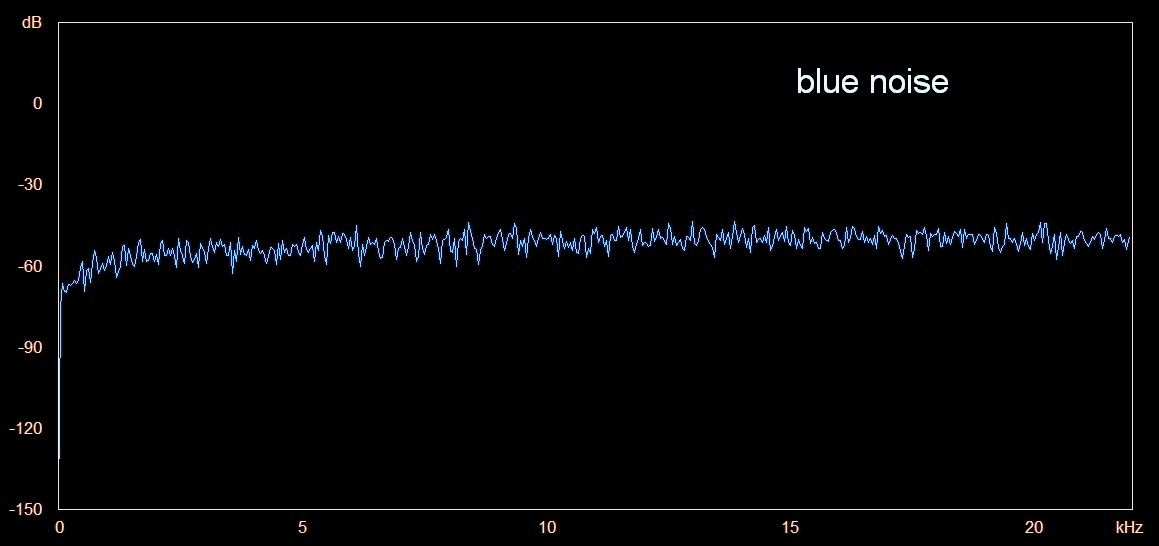
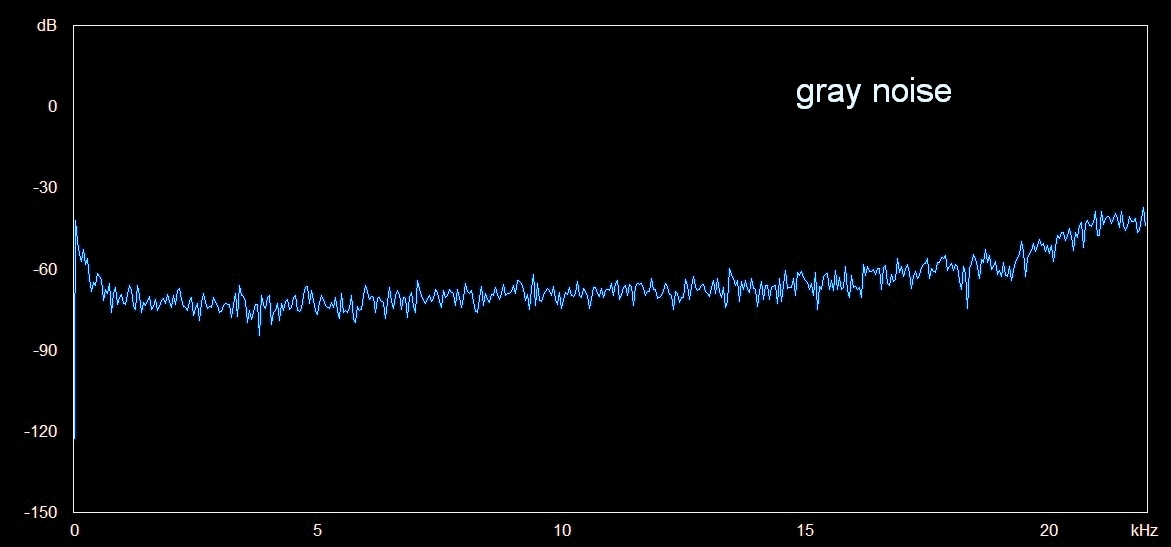
Compare my airplane sample to these. (Descriptions below each plot are adapted from AudioCheck where, again, you can listen to each sound.)
Blue (or azure) noise is like white noise, but with the bass frequencies far quieter or missing, making blue noise
sound even "brighter."
Gray noise is essentially white noise that has been "perceptually flattened" to account for the fact that the human
ear does not have equal perception at all frequencies. Spectrally, gray noise is more acute at the higher frequencies than is white noise.
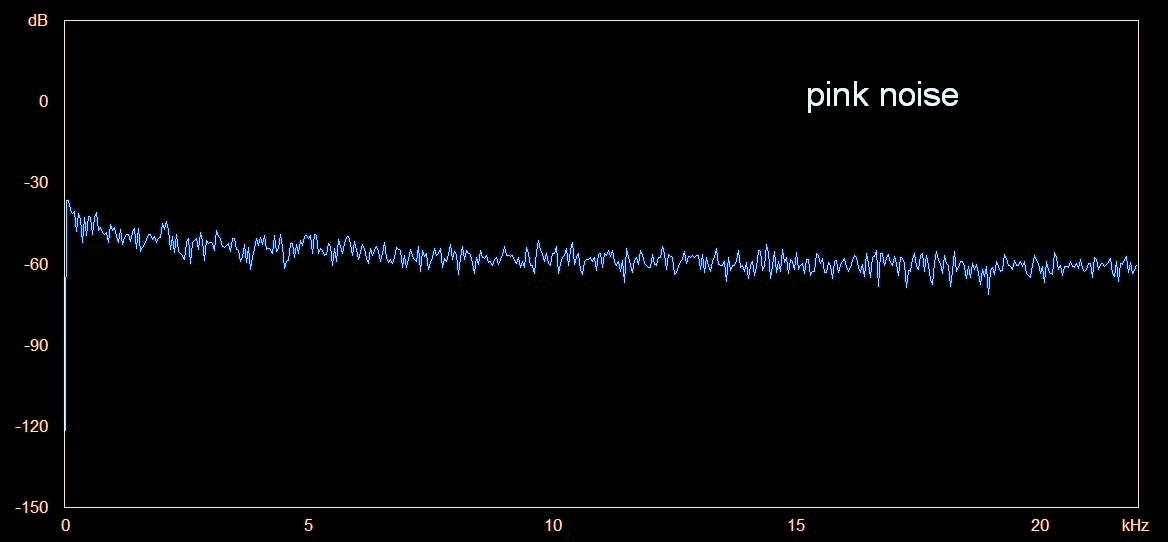
Pink noise has equal energy per octave of frequency, thus slightly boosting the lower frequencies.
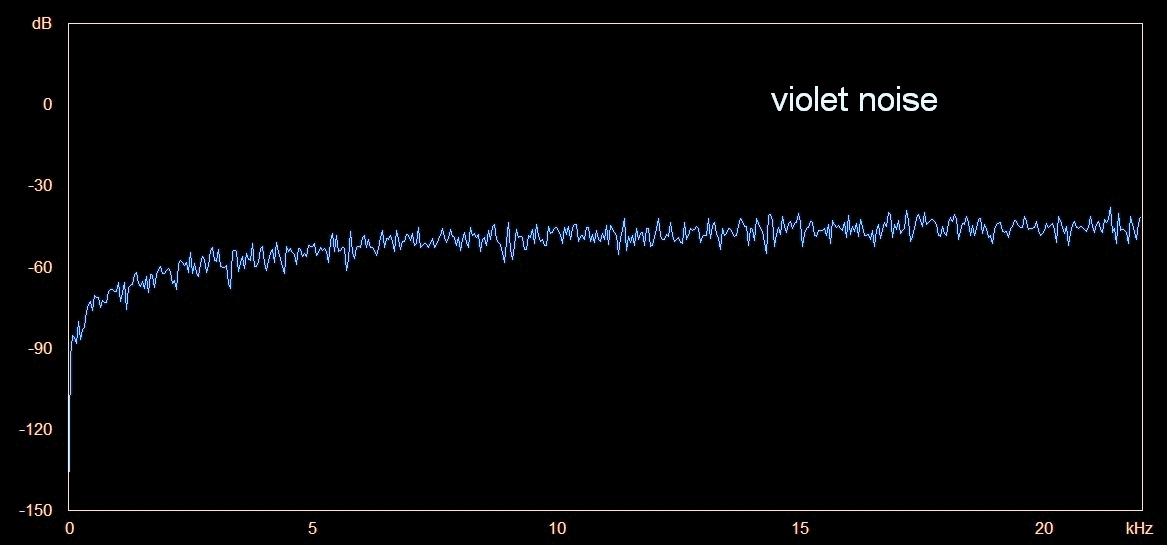
Violet noise has much higher power at higher frequencies than does white noise, with much of the lower
frequency portion toned way down or even absent.
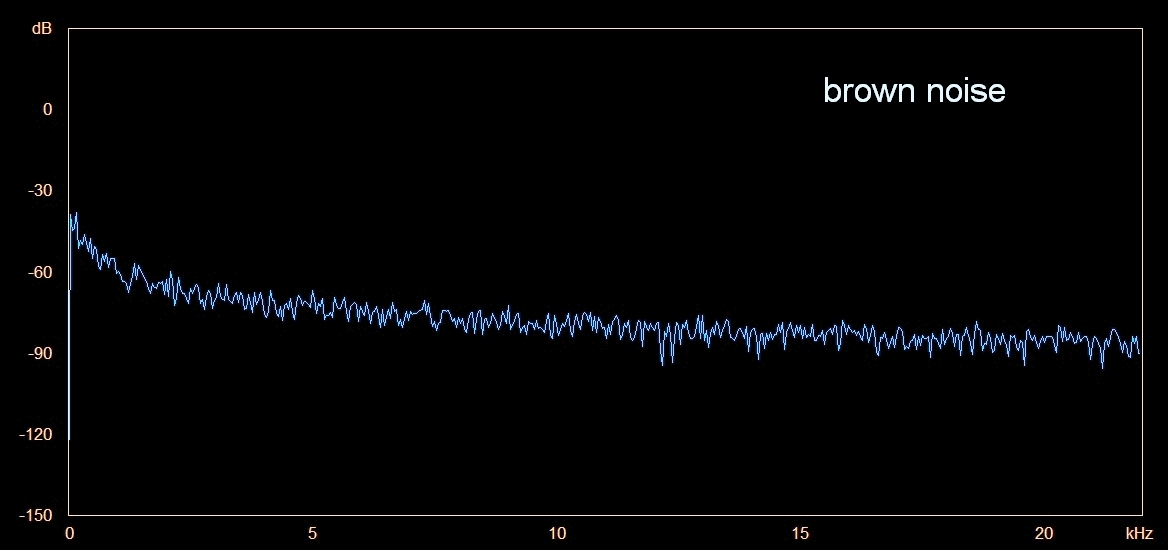
So what type of noise best matches the interior of an airplane?
It is "brown noise:"
Brown (or red) noise is filtered to produce much energy at lower frequencies, which the human ear perceives
as that deeper "whoosh" sound you get on an airplane.
Confused? Here's a simple animation flipping between brown noise and the airplane noise I recorded:
Here, you can see the similarity between the two.And here is the reason you can sleep well on a plane: brown noise is used in healthcare to treat sensitivity to normal environmental sounds. It is also used to mask tinnitus, that continual high-pitched ringing that some people hear that can be a constant annoyance.
To many travelers, then, the brown noise of the drone of an airplane -- even at 105-106 decibels! -- can act as a soporific, inducing sleep.
So again, compare the airplane noise I recorded, with a sample of brown noise (click links here for mp3 sounds).
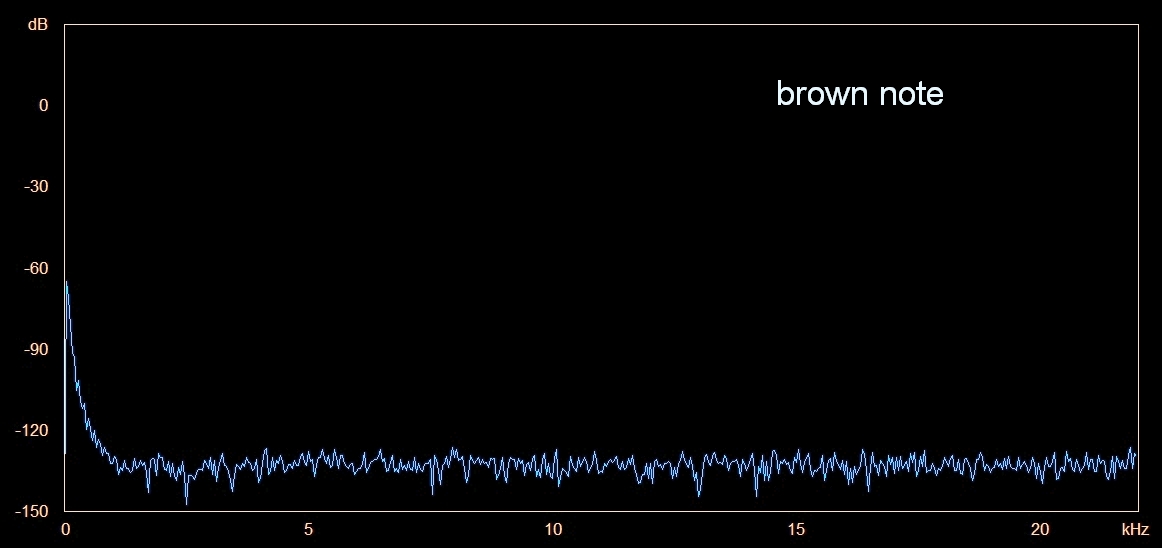
And finally, do not confuse brown noise with the brown note which is essentially infrasonic (frequencies below normal human hearing) and, at high volume, has been associated with causing the loss of bowl control ... which would be a most unfortunate situation indeed among airplane passengers ...
Nighty-night!
Technical Information:
The audio recorder I used was an Olympus Linear PCM Recorder LS-7, using internal microphones.
I produced the sound spectrogram plots using program Spectrogram v. 16.0 (Visualization Software LLC).
I measured sound amplitude in flight on my Samsung Galaxy Tab 8.9 tablet, using the app Sound Meter v. 1.6.3 initially calibrated to 0dB.
Next week's picture:
Not a Giant Mosquito
< Previous ... | Archive |
Index |
Location | Search | About EPOW | ... Next >
|
|

Author & Webmaster: Dr.
Bruce G. Marcot
Disclaimers and Legal
Statements
Original material on Ecology Picture of the Week ©
Bruce G. Marcot
Member Theme of The Plexus
